Miguel Penagos
To maintain system stability and manage diverse characteristics and resources, utilities and developers rely on PQ curve analysis. This analysis is particularly important for complying with FERC Order 827 at the Point of Interconnection (POI). Discover in this article how the extension of PSSC®E software, which incorporates PQ curve characteristics into power flow simulations, greatly contributes to power system analysis and simulation.
Understanding available reactive power
To ensure compliance with FERC Order 827 and the effective incorporation of inverter-based renewable generation, it is essential to first understand the available reactive power in the entire operating range of the plant. We can initiate this process by utilizing our existing lumped model. Through detailed simulations and analysis, we can map out the reactive power characteristics across the entire operating spectrum. This initial step is crucial for informed decision-making regarding the necessity of reactive power compensation.
Regarding FERC Order 827
The comprehensive challenge in our industry today is successfully incorporating inverter-based renewable generation while adhering to regulatory standards like FERC Order 827. This order stipulates that large facilities must maintain a composite power delivery at continuous rated power output with a power factor within the range of 0.95 lagging to leading. [1]
In this context PQ curve, “P” represents active power, and “Q” represents reactive power. The “PQ” curve is a graphical representation of the active and reactive power output or consumption of equipment, such as a solar inverter, wind turbine or storage system.
PQ curves are essential for ensuring regulatory compliance. For example, FERC Order 827 stipulates specific power factor requirements for large facilities. The curve helps assess whether the renewable source or storage system adheres to these regulations.
PQ curves for utilities
Examining the PQ curve provides a valuable tool for ensuring overall system stability. It aids decision-makers in determining whether there’s a need for extra reactive power support to uphold voltage quality or if measures for power factor correction should be considered. Furthermore, these graphs make it easier to explain the lack of reactive power capability and the underlying reasons.
PQ curves for developers
Developers have access to various options from different manufacturers, resulting in diverse PQ curve characteristics. This extends to distinct configurations of main transformers, generator step-up transformers, and collector systems. Conducting this analysis during the design phase is important to ensure compliance with FERC Order 827 at the Point of Interconnection (POI).

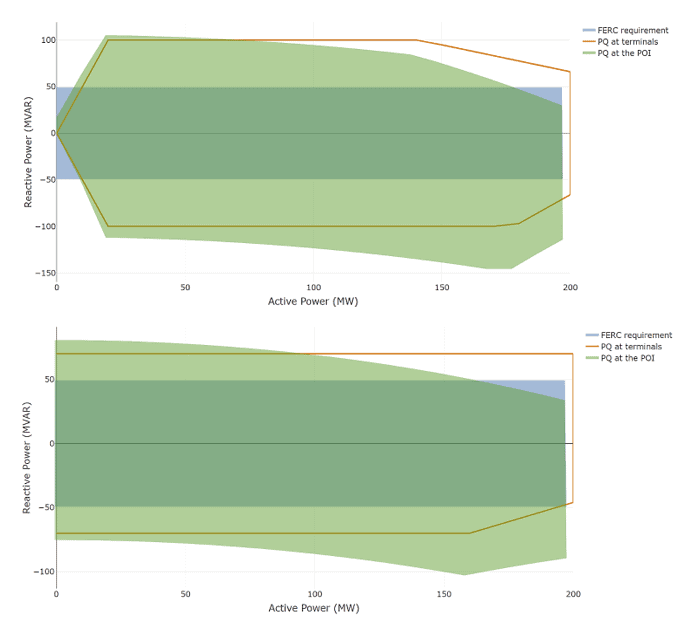
Figure 1. Simulation Results: A comparison between the original PQ curve (in green), the actual P and Q values received at the Point of Interconnection (POI), and the 0.95 per unit (pu) requirement across the entire range as mandated by FERC Order 827 for two typical cases.
Figure 1’s graphs show two examples, PQ capabilities are received at the Point of Interconnection (POI), but the losses alter their shape. Both display a clear deficit, particularly noticeable in the top right corners. Upon initial examination, enhancing passive shunt reactive compensations appears to be a potential solution.
However, a more suitable power system design could make better use of resources. Exploring adjustments to the operational point—such as tweaking tap changers—holds promise, especially considering the adaptability for modifications on the lower side of the curve. It is imperative to remain vigilant to prevent any inadvertent activation of overvoltage protections and to establish a well-defined range for capacitor connection and disconnection.
Performing simulations
After creating our lumped power flow model, the necessary sequence involves utilizing solely the plant model and an infinite single-machine model.
- Incorporate PQ curve characteristics: Integrate the PQ curve characteristics into the power flow simulations.
- Adjust active power from minimum to maximum: Modify the active power output of the generation facility, ranging from the minimum to maximum power levels.
- Assess over and underexcited scenarios: Evaluate scenarios where the system generates or consumes varying levels of reactive power.
- Measure active and reactive power at the Point of Interconnection (POI): Collect data on both active and reactive power levels at the POI.
- Ensure power factor compliance: Verify that the power factor remains at 0.95 or higher throughout the entire active power range.
It’s important to note that the specific steps and methods for incorporating a PQ curve may vary depending on the software. In this example, we could incorporate the PQ curve model using a Python script and PSS®E.
How to incorporate the PQ curve in your simulations
Expressing the PQ curve as a polygon simplifies its representation, making it easier to work with in computational processes. Shapely is an open-source Python library for geometric operations and computational geometry that provides tools to create a polygon that approximates the PQ curve based on the available data points. This allows us to easily identify the boundaries of the curve.
A vertical line can be used to intersect the polygon, revealing the points where the curve transitions from one state to another.

Figure 2a. The core of the script incorporating PQ characteristics into the PSS®E simulation. Certain sections are excluded for readability, such as the special case where P is outside the PQ curve.[2][3]

Figure 2b. Graphics for the first example above. In this case, we obtain Q limits for P = 130 MW as (70.0 MVAr, -52.6923 MVAr).
Conclusion
PSC conducts studies using various procedures and software but extending PSS®E to directly incorporate PQ curve characteristics into power flow simulations is particularly useful, given its widespread usage in the industry. Integrating open-source software, such as Shapely, plays a significant role in power system analysis and simulation.
PQ curve analysis is important for utilities to maintain system stability and for developers to manage diverse characteristics and resources. Planning this is crucial for complying with FERC Order 827 at the Point of Interconnection.
Contact us for more information!
References
[1] https://www.ferc.gov/sites/default/files/2020-06/RM16-1-000.pdf
[2] https://shapely.readthedocs.io/en/stable/geometry.html
[3] https://www.whit.com.au/blog/2011/07/run-psse-from-python-and-not-other-way/
