

Tim Miles
As the energy sector is responsible for around 75% of all greenhouse gas emissions, the transition to renewable energy sources – and net zero by 2050 – is widely accepted as essential. But, pledges by Governments worldwide are currently falling short of what is needed to limit the long-term increase in global temperatures to 1.5°C. According to the International Energy Agency, current pledges would still leave 22 billion tonnes of CO2 emissions to be dealt with worldwide by 2050.[1] This would equate to a temperature rise of 2.1°C by 2100. Despite this gloomy assessment, there are other signs that the take up of renewable energy sources is accelerating.
Energy crisis driving change
The rapid displacement of traditional sources of energy generation by renewables has been given added impetus by 2022’s global energy crisis. In its December 2022 review of the state of renewables, the IEA noted that the world is now set to add as much renewable power by 2027 as it has in the past two decades.[2] Driven by energy security concerns caused by Russia’s invasion of Ukraine, global renewable power capacity is due to grow by 2,400 GW in the next five years – an amount equivalent to the entire current capacity of China. This is a 30% higher growth rate than forecast even as recently as 2021. China accounts for about half the expected growth in renewables capacity.

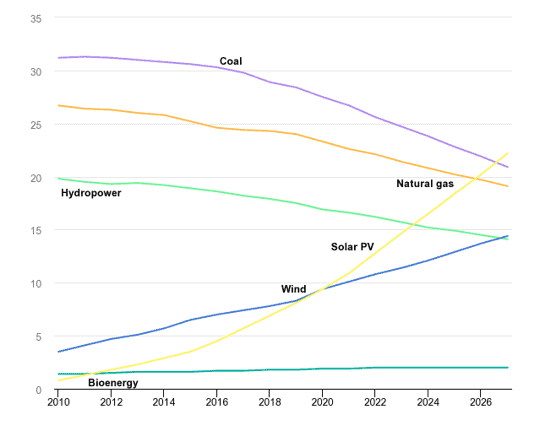
IEA, Share of cumulative power capacity by technology, 2010-2027, IEA, Paris https://www.iea.org/data-and-statistics/charts/share-of-cumulative-power-capacity-by-technology-2010-2027, IEA. License: CC BY 4.0
Solar and wind power, it is predicted, will continue to be the dominant sources of renewable energy, with renewable sources overall accounting for around 90% of new capacity over the next five years. Solar, in particular, is forecast to surpass coal as the world’s largest source of power with capacity tripling in the next five years, per IEA’s Renewables 2022 report.
Distributed grid taking shape
The expected mushrooming of solar capacity brings all the usual concerns about balancing the grid, intermittency of power generation, the need for storage and managing demand. These challenges will likely become even more pressing as the expansion in capacity will be based on a distributed power generation model. Currently, large-scale solar power plants – solar farms – account for 52% of capacity around the world, with residential installations accounting for 28% of solar power and industrial plant providing 19% of capacity. The trend is away from large-scale plants with the 52% figure (2021) being the lowest share of capacity on record.
More efficient PV panels
Of course, the expansion of capacity relies not only on the sheer number of solar PV panels deployed. The efficiency of solar power technology also has a part to play. Currently, the dominant technology is crystalline polysilicon (aka poly-Si or mc-Si). Around 95% of today’s solar PV panels are based on the technology. More efficient technologies are already in development and have been successfully deployed. Monocrystalline wafers and a more efficient cell design is gaining market share. Where poly-Si consists of a number of separate crystals. Monocrystalline panels, as their name suggests, consist of a single, homogenous crystal. At the same time, PERC (Passivated Emitter and Rear Cell) – a long-established solar cell design – is being deployed to raise efficiency by as much as 1% as well as decrease costs.
Innovative cell design
New, even higher-efficiency cell designs are also being explored. TOPCon dopes the crystal – i.e. introduces a controlled impurity (usually phosphorus or arsenic) – that modifies conductivity and increases the efficiency of a cell to 28% (compared to 24% for a PERC cell). Heterojunction (HJT) designs are also being explored. An HJT cell consists of three photovoltaic layers. The layers form a sandwich with a monocrystalline silicon layer in the middle, surrounded by two layers of amorphous silicon (a-Si). HJT panels achieve an efficiency level of 25% or more.
Global divergence
While the accelerated rollout of solar power is gaining pace, there is a wide geographic variance in take-up and investment levels. In a seminar on the Global Landscape of Renewable Energy Finance, the International Renewable Energy Agency (IRENA) noted that per capita investment in renewable energy shows a wide divergence between sub-Saharan Africa and the developed regions of Europe and North America.[3] What’s more, the divergence is growing. In 2015, per capita investment was 22 or 23 times higher in Europe and North America. In 2021, Europe and North America benefited from investment rates that were 41 times and 57 times higher than Africa respectively. This means that 85% of renewable energy investment in 2022 was absorbed by less than 50% of the global . Yet, according to the IEA, “utility-scale solar PV is the least costly option for new electricity generation in a significant majority of countries worldwide”.
Globally, China attracts the most investment in renewable technologies, accounting for nearly half the global total of $1.1 trillion in 2022.[4]
Pressure on developing economies
Of course, developed economies represent greater levels of energy demand and consumption, but – even so – for developing economies to meet their development goals sustainably means that investment in these areas probably needs to increase significantly. Barriers such as high levels of Government debt may, according to IRENA, be holding back potential investment in renewables in these regions.
So, on balance, the overall picture for renewables is hopeful. Solar, in particular, is undergoing a rapid expansion in capacity. But, set against these positive signs, poor performance in meeting emission reduction targets in other areas needs to be entered into the balance sheet.
References
[1] IEA, Net Zero By 2050, May 2021, https://www.iea.org/reports/net-zero-by-2050
[2] IEA, Renewable 2022, https://www.iea.org/reports/renewables-2022
[3] IRENA, Global Landscape of Renewable Energy Finance 2023, May 2023, https://www.irena.org/Events/2023/Mar/Global-Landscape-of-Renewable-Energy-Finance-2023-webinar
[4] Bloomberg New Energy Finance, Energy Transition Investment Trends, January 2023, https://about.bnef.com/blog/global-low-carbon-energy-technology-investment-surges-past-1-trillion-for-the-first-time/